Blog: posted by Steve Hosein, June 1, 2017
Survey reveals correlation: the more customers value your business, the more they leave comments
I stumbled across an interesting - and potentially useful - correlation while analyzing some data from a customer survey and I thought it was worth sharing. Only one data set has been examined, but if this relationship turns out to be widely applicable, it could provide a means for business owners and marketers to subtly monitor how customers value their businesses. The customer survey was distributed via a very successful email campaign, about which I wrote previously. In this survey, the proportion of respondents who left a comment correlates nicely with how much they valued the store.
Before clarifying how I determined what value a business holds for a customer, I'll give a little background on the survey. The primary purpose was to determine the best location for this retail business and a secondary purpose was to try to get a feel for how customers viewed shopping in a brick-and-mortar store versus online. Regarding the primary purpose, we've often heard the mantra "location, location, location"; with respect to a brick-and-mortar store, this is obviously highly appropriate. Regarding the secondary purpose, a physical location is important to my client's customers but the increasing presence of online stores has made life difficult for the business. Margins have been eaten away by competitors undercutting each other. You are likely familiar with the various aspects of this issue, the pros and cons viewed from both the consumers' and the retailers' sides, so I won't discuss that here.
We had anecdotal evidence that many customers valued my client's store, where they could touch the merchandise and receive expert assistance. There were several indications that a certain customer segment would willingly pay more in-store than elsewhere online, due to both the sales and after-sales support offered but additionally to help ensure that the store survived. We were also aware that the other extreme existed: some customers will browse in a physical store and use up a retailer's valuable time all the while planning to buy the item online afterwards. In order to determine the extent to which customers valued my client's store, this pointed question was included in the survey:
Imagine you see Amazon offering xyz for $400 (you do not check the cost of shipping which may or may not be free). The next day, you come to our store and see a similar item. You decide that you want to buy the item. Which statement best describes how you would feel?
(Choose one statement that describes you the best) (eg - if you choose $460, you would likely buy from the store as long as the price is under $460)
- If the store price is higher than $400, I will go home and order from Amazon
- If the store price is higher than $420, I will go home and order from Amazon
- If the store price is higher than $440, I will go home and order from Amazon
- If the store price is higher than $460, I will go home and order from Amazon
- If the store price is higher than $480, I will go home and order from Amazon
- I'm sorry, I don't understand this question
My definition of value, for the purpose of this article, is based on the customers' indicated willingness to spend more in my client's store than they would spend for a similar item online. It is that added value beyond what a competitor offers. The results of the thirteen-question survey were enlightening but I cannot share them as they would likely benefit my client's competitors. I can share that nearly 500 valid responses were recorded (36 respondents indicated that they did not understand the question).
A fascinating aspect of the survey was that such a high proportion (179 of 512 = 35%) of respondents actually left a comment. At the end of the form, I had left a space in which people could comment if they so desired. It was clearly labelled "optional". Obviously, comments have great value from a qualitative point of view but given the surprisingly high number of respondents that left a comment, I became very curious to see if some quantitative information could also be extracted. Using a pivot table, I segmented respondents by the response they had given (value from $400 to $480). Then for each segment, I determined the proportion of respondents that had left a comment (the nature of the comment was not considered). The results were plotted and clearly showed that customer segments that "valued" the store more highly, also had a higher proportion of people who commented.
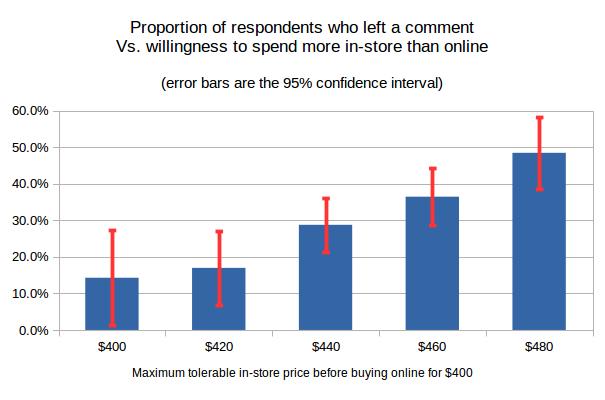
I have attempted to treat the data rigorously by showing the 95% confidence intervals for each proportion. Note that the while neighbouring segments' confidence intervals show some overlap, the next segment over does not. Thus, the $460 dollar segment clearly has a statistically valid, higher proportion of commenters than the $420 segment. Likewise, the $480 segment has a higher proportion of commenters than the $440 segment.
I mentioned in the opening paragraph that this could be a subtle tool. By leaving an optional space for comments, it's like getting an answer without having to ask the question. This is old news from the qualitative research perspective; but from this particular quantitative perspective, it's new and exciting. It is unlikely that any absolute measure could be attained in this way, but I suspect that even relative measures (perceived value is increasing, decreasing, or stable) would be very useful. This is an area that warrants further research.
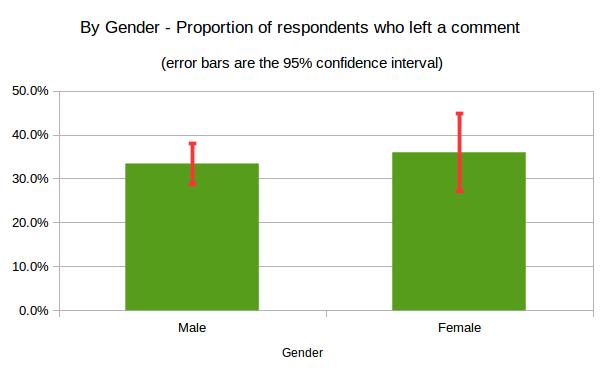
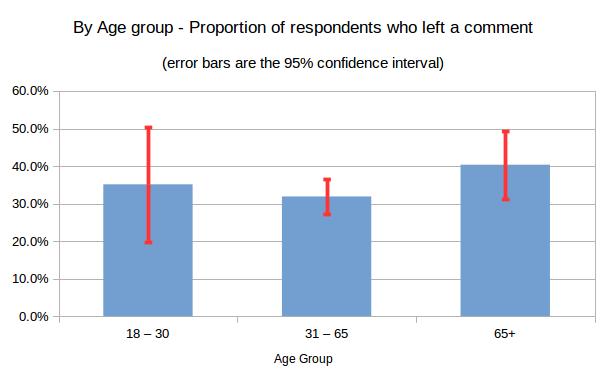
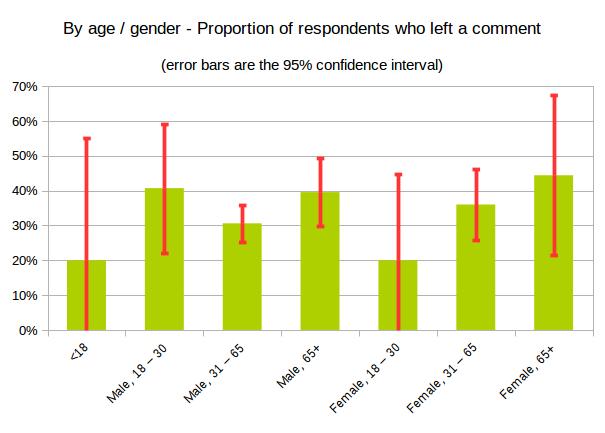
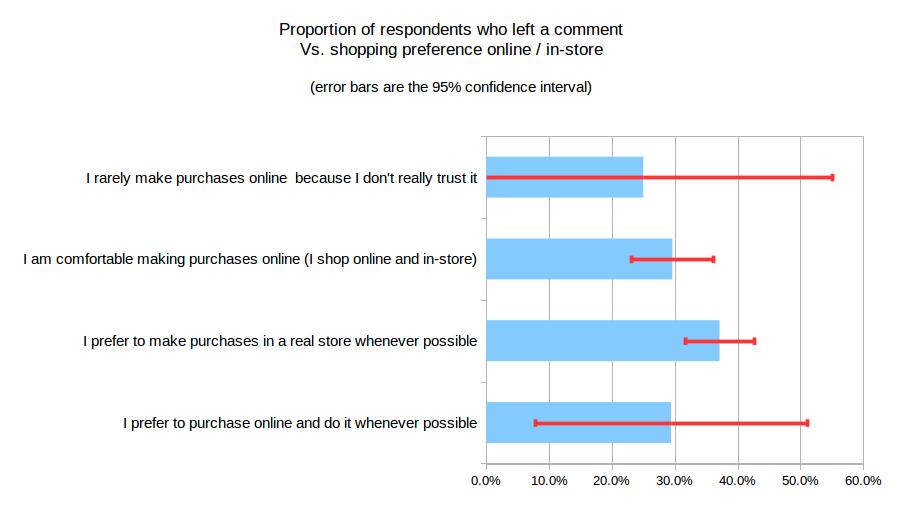
The proportion of commenters amongst customers segmented by other parameters did not show any correlations. I looked at age, gender, a combination of age and gender, and finally comfort level with internet shopping. No correlations were observed. The fact that other correlations were not observed lends strength to our conclusion that a proportional relationship - independent of other variables - exists between the value which a customer ascribes to a business and his or her likeliness of leaving a comment on a survey.